December Newsletter – Tis the Season for Chasing Returns
How Investment Bubbles Work
“Keep in mind how investment bubbles work. A bubble always starts with some real factor that takes on increasingly exaggerated importance in the eyes of investors. The bubble expands not on facts but on untethered imagination. People imagine that X will result in ever-increasing prices, and assume that an endless crowd of buyers is still behind them – dot-com stocks, technology, housing, “tronics” stocks in the 60’s, the Nifty Fifty in the 70’s, quantitative easing, tulip bulbs. Regardless of whether the mechanism underlying that concept is fictional, and regardless of how tenuously it is linked to reality, a bubble advances as long as the adherents it gains are more eager than those it loses.” -Bill Bonner, The Daily Reckoning, June 25 2007
Hussman, John P., Ph.D. “The Elephant in the Room.” Weekly Market Comment (n.d.): n. pag. Web. 2 Dec. 2013.
When to Buy and When to Sell
Test Your Stock Market Skills
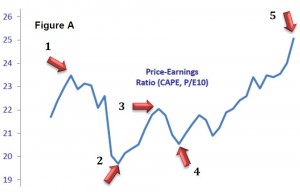
 Figure A displays the prices we pay for $1 worth of earnings for the S&P 500 over an unidentified three year period. At which of the five numbered arrows would you think it best to own more stock funds in your account, and at which would it be better to hold a smaller portion of your assets in stock funds?
Without knowing where the line will take us in the future, most investors will say to own more at points “2” and “4” and own less at points “1” and “3. In fact, it is much harder to make a choice at point “5” because we do not know where the line will head from there.
Yet, the natural behavior of the typical investor is a response of “fear and greed”, wanting to BUY more at points like “1” and “3” (after watching market prices rise) and SELL after we reach points like “2” and “4” (when a market sell-off has occurred). “Hindsight bias” leads us to extrapolate from the recent past and assume those trends will continue. It is why most investors choose to buy mutual funds with the best 1-, 3- and 5-year performance and sell those with the worst 1-, 3- and 5-year performance, no matter the type of asset class, style of fund, etc.!
Now, we will let you in on a little secret – Number 5 is where we are today. From point “4” to point “5”, inflation-adjusted earnings have risen less than 2%, while the price we pay for those earnings has risen over 22%. We are paying over $25 for every share of corporate earnings today, far higher than the $18.77 we have paid on average since 1950 and the $16.51 average dating back to 1881. In fact, the price we pay today is identical to the price we were paying in December, 2007 – and we all remember where the line headed from there.
We think it makes common sense to wait for more of the “2”s and “4”s to show up before we entertain becoming more aggressive with client accounts.
What About My Five-Year Retirement Plan?
Here is a continuation from last month’s newsletter about when to start thinking about retirement. Visit last month’s newsletter for information that investors 5 years from retirement should be thinking about.
4 Years from Retirement
- Where are you planning to spend your retirement? Look into different communities where you may want to settle. Think about the expenses for moving to those communities.
- Do I want to volunteer for an organization in retirement? There are a number of great organizations that need volunteers. If you plan to volunteer, now is a great time to start volunteering to find an organization that fits you!
- When should I start taking my Social Security? Social Security can be taken between the ages of 62 to 70. The longer you wait the larger your payout will be. Remember to keep in mind life expectancy, income taxes and spousal benefits.
Being able to answer these questions will help you to piece together your retirement puzzle. Taking time to address these areas helps create a more comfortable transition into retirement. Next month, we will take a look at what we should be doing 3 years out!
Cost of Gifts in “12 Days of Christmas” Increase
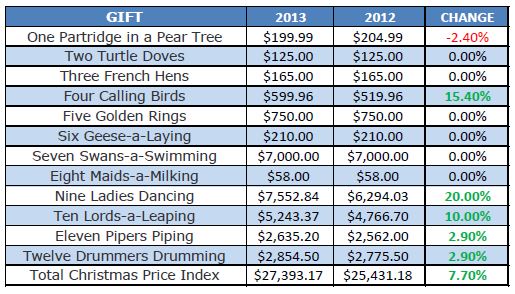
Led by double-digit increases in Ladies Dancing and Lords-a-Leaping, the cost of the gifts in the song, “The Twelve Days of Christmas,” have risen 7.7% this year – far outpacing the Consumer Price Index’s measure of inflation, which was measured at 1% in September.
The “Christmas Price Index,” which tracks the cost of the gifts, is compiled by PNC Wealth management each year since 1984.
- PNC CPI website: http://www.pncchristmaspriceindex.com/intro
- http://www.plansponsor.com/NewsStory.aspx?id=6442495822

